I’ve been doing a bit of performance tuning on some of the clusters I look after at work and started looking deeper into CPU Ready times. This particular metric has always been something I’m aware of and it’s impact on performance but I had never gone looking for issues relating to it. Mostly because I’d never had a host or cluster that was that over-subscribed!
Anyway, I thought I’d do a quick post on what CPU Ready times mean, how you can measure them and how you can help reduce them…here goes.
What is CPU Ready???
The term CPU Ready is a bit confusing at first as one would assume that it refers to how much CPU is ready to be used, but this is not the case. The lower the CPU Ready time the better!
CPU Ready is the percent of time a process is ready to run but is waiting for the CPU scheduler to allow that process to run on a physical processor. I.e. “I’m ready to go but I can’t do anything yet!”.
So now that we have a better understanding of what CPU Ready is, lets look at what can cause this value to increase and hurt your VM’s performance.
What causes CPU Ready times to increase???
1. Over-commitment/Over-subscription of physical CPU
This would be the most common cause and can happen when you have committed too many vCPU’s in relation to the number of physical CPU cores in your host.
From what I have read it seems that for best performance you should keep your pCPU:vCPU ratio equal to or less than 1:3. So in other words, if your host has a total of four CPU cores, you should not allocate more than a total of 12 vCPU to the VM’s on that host. This isn’t to say you can’t have more but you may run into performance problems doing so.
2. Using CPU affinity rules
Using CPU affinity rules across multiple VM’s can cause high CPU Ready times as this can restrict how the CPU scheduler balances load. Unless specifically required I would not recommend using CPU affinity rules.
3. Using CPU limits on virtual machines
Another potential cause of CPU Ready is using CPU limits on virtual machines. Again, from what I have read I would suggest that you do not use CPU limits unless absolutely necessary. CPU limits can prevent the scheduler from allocating CPU time to a VM if it were to violate the limit set, hence causing ready times to increase.
4. When Fault Tolerance is configured on a VM
The last scenario could be where you have deployed a VM using FT and the primary and secondary VM can’t keep up with the synchronisation of changes. When this happens the CPU can be throttled causing higher ready times.
Now that we’ve covered what can cause CPU Ready times to increase, lets look at how to measure them and reduce them. For this example I’ve used the most common cause, over-provisioning.
How do I look for CPU Ready issues???
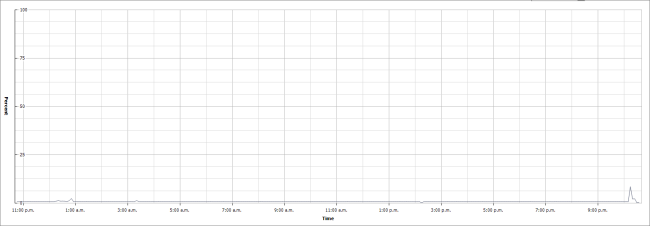
Take the example below; it is a VM that has been configured with four vCPU. Looking at the last days CPU usage you can see this particular VM is doing almost nothing (it is a test VM).
When I then look at the CPU Ready times for the same period I see that the summation value is around 9200ms. Remember that both of these charts are the last day roll up.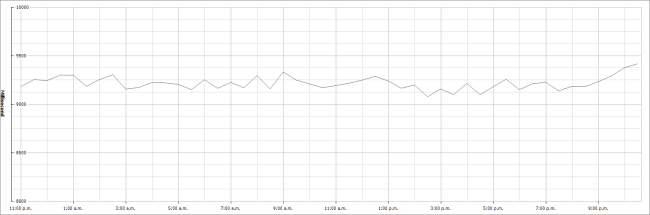
Now you are probably thinking, what the hell does that mean? Well, we can convert this summation into a percentage to make things a little easier to quantify.
The formula is simply this:
CPU Ready % = (Summation value / (chart update interval in seconds x 1000)) x 100
Each of the available update intervals are listed below (refer to KB article 2002181: http://kb.vmware.com/selfservice/microsites/search.do?language=en_US&cmd=displayKC&externalId=2002181)
- Realtime: 20 seconds
- Past Day: 5 minutes (300 seconds)
- Past Week: 30 minutes (1800 seconds)
- Past Month: 2 hours (7200 seconds)
- Past Year: 1 day (86400 seconds)
So returning to our previous chart of the last day we get:
(9200 / (300 x 1000)) x 100 = 3.06%
Now this isn’t a bad CPU Ready time percentage but it will do for the purposes of this example. VMware recommends that for best performance CPU Ready % should be less than 5%.
Based on the fact that my virtual machine is by no means busy and it has been given 4 vCPU I will now drop this back to 2. Yes I could drop it back even further to 1 but for the purposes of this example I’ll bring it back to 2 🙂
After powering off the VM, changing the vCPU and powering back on I get a significant drop in CPU Ready time as seen below in a Real-time chart.
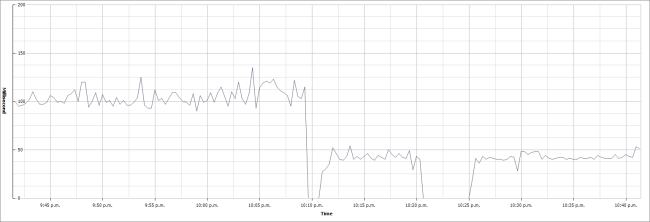
Running a new calculation on this value of around 54ms (a very rough guesstimate average :-P) we get this:
(54 / (20 x 1000)) x 100 = 0.27%
As you can see the average CPU Ready time has decreased quite significantly by simply lowering committed resource to the VM. Obviously this would only be practical on VM’s that are not vCPU constrained.
In my experience most people (myself included) over allocate vCPU, particularly when translating vendor hardware requirements into virtual machine requirements! Some of the worst I’ve seen are when sizing some of the Microsoft System Center products. The sizing guides often suggest dual quad-core physical servers, but this does not mean you should give your VM eight vCPU.
I think the best approach is to size lower and adjust accordingly if you are hitting a CPU resource limit. Spend some time looking over your environment and see where you might be able to tune your performance, you might be surprised at how much you can improve it!